 |
 |
 |
 |
 |
 |
 |
 |
 |
 |
 |
 |
Opinion of tools
Name of the case study
Water savings in Copenhagen
Name of tool
Indicators on water consumption
Opinion of tool - argumentation for choosing the tool
There were different environmental and organisational pressures to reduce water consumption, and therefore the tool was implemented. The water saving campaign carried out by Copenhagen Water was not directed from any national or international regulation.
The water saving campaign was run by the Copenhagen Water, and the the data on water consumption were accessible, and made sense as an indicator. There was no knowledge of other tools. openhagen Water have been interested in experiences from other municipalities on how to achieve water savings, but they have found no similar experiences or tools.
Opinion of tool - barriers for the tool implementation
There were no main problems related to the use of indicators. In general, however, it is difficult to regulate the water consumption as it is decided by a lot of different factors. As a regulator, Copenhagen Water can, through its initiatives, only influence a elements, for instance the habits of the consumers and leakages from water pipelines.
Another problem is that relatively few households in Copenhagen have individual water meters, and therefore have no knowledge about their water consumption. For this reason, installation of water meters is being promoted. Another initiative is to develop a tool to assess the water consumption of a household, based on the consumers own information on water habits. This tool will enable consumers without water meters to get an idea about his or her water consumption, and compare it to the average consumption in the municipality, or the goals for the future consumption.
Opinion of tool - assessment by tool users
There were measurable improvements (and no unintended consequences) as a result of using this tool. From 1989 to 1994 the average water consumption in Copenhagen was reduced by 18%, from 168 to 138 litres per person per day. This was not only due to using the indicators and the campaign – also the raising price on water had a main impact. Based on the current success, a goal for water consumption in 2001 of 110 liters/person/day was formulated as a part of the Water Supply Plan in 1994. This was basically a projection of the development from the former 5 years. Right after the plan was accepted, however, the fall in consumption started to decrease. In the following years the consumption only fell by 7 liters, to 131 l/p/d, whereas in the first five years it fell with 30 l/p/d. In 2001, when the Water Supply Plan from 1994 had to be revised, it was clear that the goal of 110 l/p/d in 2001 could not be reached, as the average consumption was 127 l/p/d, or 15% above the goal. In the revised plan it was therefore decided to postpone this goal on 110 liters to for 2010, and insert a goal on 120 l/p/d in 2005 (see figure below).
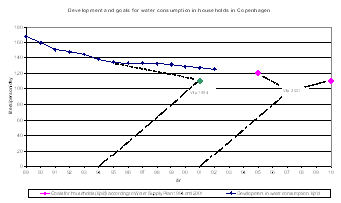
The development of water consumption in Copenhagen 1989-2001, also showing the goals for water consumption for 2001, 2005 and 2010.
These goals were decided in relation to, what was considered as “realistic” and “politically acceptable”, and not based on considerations on sustainability, e.g. what was necessary to maintain the state of the nature in the water catchment areas. In 2003, the average water consumption was 127 l/p/d, the same as for 2001.
In terms of a general over view of the tool, the end-users express a need for evaluations, and means to prioritise different efforts for a more sustainable water management. This includes a prioritisation between different water saving methods and initiatives, and prioritisation between water savings and other efforts for protection of the groundwater. At the moment, there is little overview over the costs and effects of different possible initiatives, and therefore it is difficult to prioritise between the different initiatives.
In the future, the indicator on water consumption will still be used as an important measure for sustainable water management in Copenhagen. Since the merge of Copenhagen Water and Copenhagen Energy, the liberalisation of the energy market in Denmark has had considerably influence on the efforts for water reductions; budgets have been reduced, and the number of people employed on water savings has been reduced to 1½. Organisationally, the water saving unit has become an independent unit in Copenhagen Energy, selling its services to CE. The main focus is implementing individual water meters in households. At the moment, only about 8000 households have individual water meters (out of app. 240.000 households in Copenhagen). By supporting each household by 1.000 DKr (app. 150€) for installing water meters, Copenhagen Energy hopes to increase this number. For those who have individual meters, the average consumption is 108 l/p/d, indication that individual meters has an effect, and that the goal on 110 l/p/d is not unrealistic.
Using this indicator is evidently an advantage. It is also being used on a local scale to monitor local initiatives and policies for water savings.
Opinion of tool - reviewer\'s assessment
The water saving campaign has focused on consumers habits, and has been quite successful. Other indicators to monitor the success of sustainable water management in Copenhagen should be included, for instance:
• Available groundwater resources in relation to different goals for the local nature,
• The use of fertilisers and pesticides within catchment areas,
• Number of farms converted to organic farming,
• Area of forest raised in the catchment areas,
• Number of water catchment plants renovated,
• State of nature and biodiversity in catchment areas,
• The diffusion of water saving washing machines, dishwasher, low-flush toilets etc. in Copenhagen households,
• The number of households with individual meter,
• Average household size in Copenhagen.
Such indicators would enable monitoring the actions of other relevant actors in relation to sustainable water management, and turn more attention to this.
What tools were used to assess sustainability?
Indicators on water consumption
More information