 |
 |
 |
 |
 |
 |
 |
 |
 |
 |
 |
Tool Characteristics
Name of the tool
"Pollumeter" for Brussels-Capital Region
Data required to utilise tool
IBGE-BIM (Brussels institute for
Environment) has a network of measurement stations that continuously record the concentration of pollutants in the air. Based on these findings, two indicators provide a snapshot of the quality of the air breathed in in the Brussels Region. The Pollumeter displays two dynamic indicators. Its values are updated in real-time (every hour), and are averaged over the last 24 hours.
The global indicator is calculated by bringing together data measured at 10 stations indicating ozone (03), nitrogen dioxide (NO2), sulphur dioxide (SO2) and suspended particulates (PM10). It provides an estimate of the entire Region´s air quality.
The traffic indicator conveys pollution in areas close to road traffic, based on data of nitrogen oxides (NO2) and carbon monoxide (CO).
Form of output
The Pollumeter is presented on the website http://www.ibgebim.be/ and looks like:
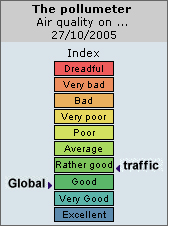
Pollumeter on 27/10/05, taken from http://www.ibgebim.be/
Type of data output
The output is qualitative (the indicators are based on local measures:Global (O3, NO2, SO2, etc) and Traffic (NO2 and CO) and quantitative (The appreciation of the air pollution could be seen on a qualitative scale (thresholds from European directives)).
What format is the tool available in?
The data and information on the tool is available from the The Brussels Institute for Management of the Environment, or IBGE-BIM, which is the environmental and energy watchdog of the Brussels Capital Region. IBGE-BIM acts, from the regulatory standpoint, as a research, planning, advisory and information body, as well as an issuer of permits, and a surveillance and control agency. From the sectoral standpoint, it has authority in the areas of waste, air quality, noise, parks and forests, water, soil and energy. http://www.ibgebim.be/
What language/s is the tool available in?
French, Dutch or English
Characterisation of the tool
This is a Monitoring tool :Indicators and benchmarks
Factors covered
Environment |
Social |
Economic |
Governance |
1 | 0 | 0 | 0 |
Stage when tool is usually used
Inception of idea |
Design |
Design assessment |
Construction |
Operation |
Demolition |
0 | 0 | 0 | 0 | 1 | 0 |