 |
 |
 |
 |
 |
 |
 |
 |
 |
 |
 |
Tool summary
Name of the tool
Green Accounting for Residential Areas, version 3.1.
Description of the tool
A web-tool for calculation and visualisation of a buildings consumption of electricity, heat, water and waste production. An excel-sheet is downloaded from DBUR´s homepage, and specified data for the buildings consumption, including the type of infrastructure, is filled in the sheet. In the sheet are data from various infrastructure types, degree days and data for average consumption rates from buildings in Denmark. The output consists of tables that compare the buildings consumption and emissions of CO2 to other buildings.
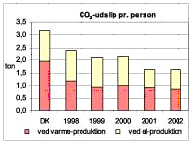
Table comparing the buildings consumption and emissions of CO2 to other buildings
Comparison of the green accounts from different years clearly reveal, if improvements have been achieved and can serve as an incentive for action. All data are presented as consumption per person per year.
Specific topic
It covers several sectors.
Sector/s of use
Waste |
Energy |
Water |
Transport |
Green/Blue |
Building & Land use |
1 | 1 | 1 | 1 | 1 | M |
M - main sector, 1 - sub sector and 0 - n/a
Scale of applications
Component |
Building |
Neighbourhood |
City |
Region |
0 | 1 | 0 | 0 | 0 |